
What is Compass?
Compass enables you to benchmark and compare operational, financial, and clinical performance across a country, a region, a network, or within a single organization. Use your chosen metrics to assess performance, compare opportunities for improvement, identify best practices, and collaboratively share findings.
How Can Compass Help My Organization?
The TWHS Compass system offers a powerful combination of benchmarking, comparative analytics, and collaborative professional networking applications to help single as well as groups of organizations understand their performance relative to their peers and share best practice approaches to improve.
Compass supports three core objectives:
- Improvement of patient care costs, quality and outcomes
- Improvement of operational efficiencies and resource utilization
- Improvement of staff, provider, and management performance
Define. Measure. Visualize. Compare. Communicate. Improve.
Define
Your organization may define any number of metrics you wish to assess. Indicators related to such subjects as clinical measures and outcomes, satisfaction, productivity, efficiency, access, and finance may be established for comparison against your targets or data from the group, regional, or national level. Benchmarks are made for each metric. Where appropriate, cost data may be incorporated into each metric to illustrate the financial benefits or consequences of specific levels of performance.
Measure
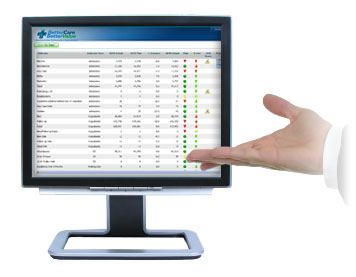
Data from many different sources and formats may be used for comparison and presentation. National, regional, or local benchmarking data may be shown against actual performance. Data is gathered electronically through standard interfaces or, where electronic submission is not feasible, can be entered directly by participating organizations. This combined data is then measured against performance targets and presented in an easy-to-understand visual “dashboard” display.


Visualize
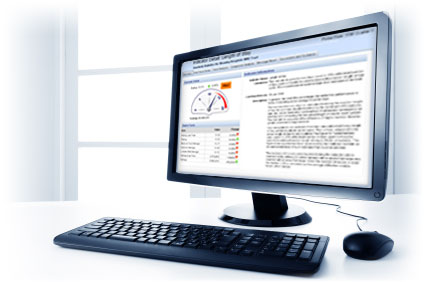
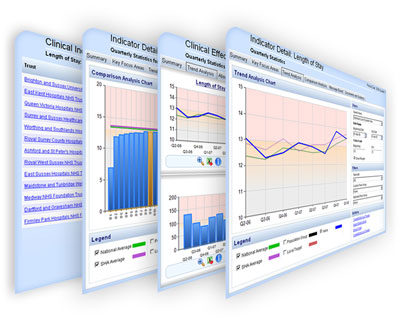
Effective presentation is essential for rapid understanding. Compass offers a wide variety of ways for you to communicate performance data in an appropriate manner to your people. Extensive use of online graphical displays and trend analyses allows detection of emerging patterns as well as benchmarking and comparisons. Compass gives you access to in-depth analysis including past, present and future trends via intuitive, appealing dashboards.
Compare
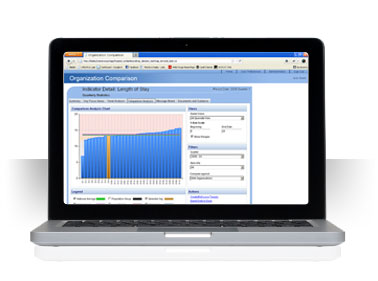
Analyzing and standardizing the data to create performance baselines, benchmarking, and peer group comparisons is essential for valid comparisons and meaningful understanding. This allows rapid identification of patterns of best practices as well as opportunities for improvement. Compare data from period to period across participating organizations or within your own organization to identify patterns or underlying trends.

Communicate and Improve
After visually illustrating variances from expectations, contributing factors may be appended to understand contributing factors and identify best practices. Implications may be determined, for example, in terms such as financial improvement expected by reaching average performance. Publications may be included to illustrate winning strategies for performance for the various indicators.
Collaborative Professional Networking – Working Together for Improvement
Across any organizations or departments measured by Compass, collaboration tools may be enabled to help people and organizations work together to better understand what can be done to raise the bar on performance for each indicator.
Collaborative tools allow organizations to publish documentation to help others understand how to achieve better performance. Online discussions can help clarify the suitability and results of different approaches. Improvement can be visually tracked and assessed over time to prove the effectiveness of any given strategy.

Compass’s History

The United Kingdom’s National Health Service (NHS) is obliged to demonstrate that it is making the most effective use of public money to deliver quality care. In 2006 the NHS implemented The Compass (then Better Care, Better Value or BCBV) system, providing a single health care improvement portal covering performance indicators for all hospitals, purchasers of care, and health service management across all of England.
The NHS BCBV system was designed to improve the quality and efficiency of care and was based around a set of national indicators that identify potential areas for improvement. These indicators could be compared nationally, regionally and locally to help inform planning, to advise on the costs and scale of potential savings, and to generate ideas regarding how to achieve these savings.
The NHS BCBV system became a staple of hospital executive reports, government policy development and media articles helping to drive health care improvement in the United Kingdom. For every pound(£) invested in the system, it identified at least 4,000 pounds in avoidable waste and inefficiency. It was used in a landmark study to identify over £4 billion in annual avoidable hospital costs alone.
TWHS has fine-tuned this same beneficial technology to meet the needs of the US Healthcare system, and in particular, the operational and financial management needs of providers.
The Bottom Line:
Transparent, objective comparative information drives cost and quality improvement
Compass identifies potential areas for improvement and efficiency so you can make best use of resources to deliver quality patient care. Importantly, these measures are all based on organizational goals and not on a “canned” solutions. Data may be used to report potential cost savings in specific operational performance areas, backed by best practice guidelines regarding how these cost savings could be realized. This is complemented by the publication of comparative quality indicators to offer an informed picture of the overall cost/quality balance on an organizational level as well as across the entire group.
How Do I Get Started?
Contact us today to get more information and schedule a demo.
